Watching the Economy by Clint Burdett CMC® FIMC
Steady as You Go, Slow, in 2014
November 25, 2013
As the Dow Jones Industrials and S&P 500 shoot the moon, I think it is time to be a bit cautious about stocks since investors may be too optimistic.
In other articles I pointed out average hourly earnings are not growing from the same period last year and total employed in the USA is flat. So the earnings multiplied by number employed trend is flat. That trend has been apparent since the early 2000s.
We continue to experience employment headwinds. Where is the extra demand to spur growth in 2014?
From ValueLine's Quarterly Economic Review November 22, 2013, a sanguine view [my emphasis in bold]:
Assuming we will not see an encore in Washington, we would look for the economy to pick up slowly, but steadily, over the next few quarters, with growth edging up toward 3% by the end of 2014, but averaging closer to 2.5% for the year. A resumption of the upswing in housing, additional gains in business investment, further modest employment increases, and a corresponding reduction in the U.S. jobless rate underscore our positive expectations for 2014 ... . Then, we would expect an extension of the recovery out to late decade. Still, we do not envision an expansive upturn, such as we had in the 1960s, the 1980s, or the 1990s. Back then, stronger fundamentals were in place. Given the depths from which we have come, though, with perhaps the worst downturn since the Great Depression being suffered from 2007 to 2009 - including a collapse in the housing market - an understated upturn, such as we would expect to see, might be welcome, especially as the absence of a boom would clearly lessen the odds of a subsequent bust.
An Example
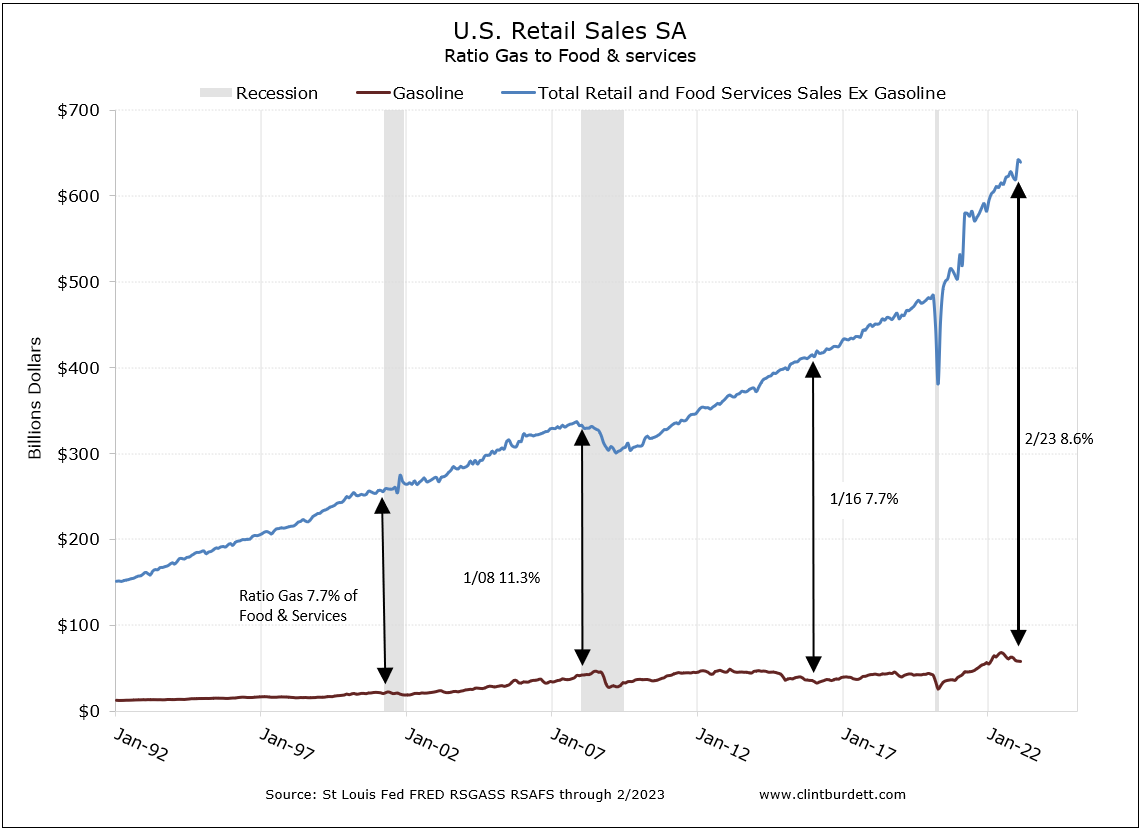
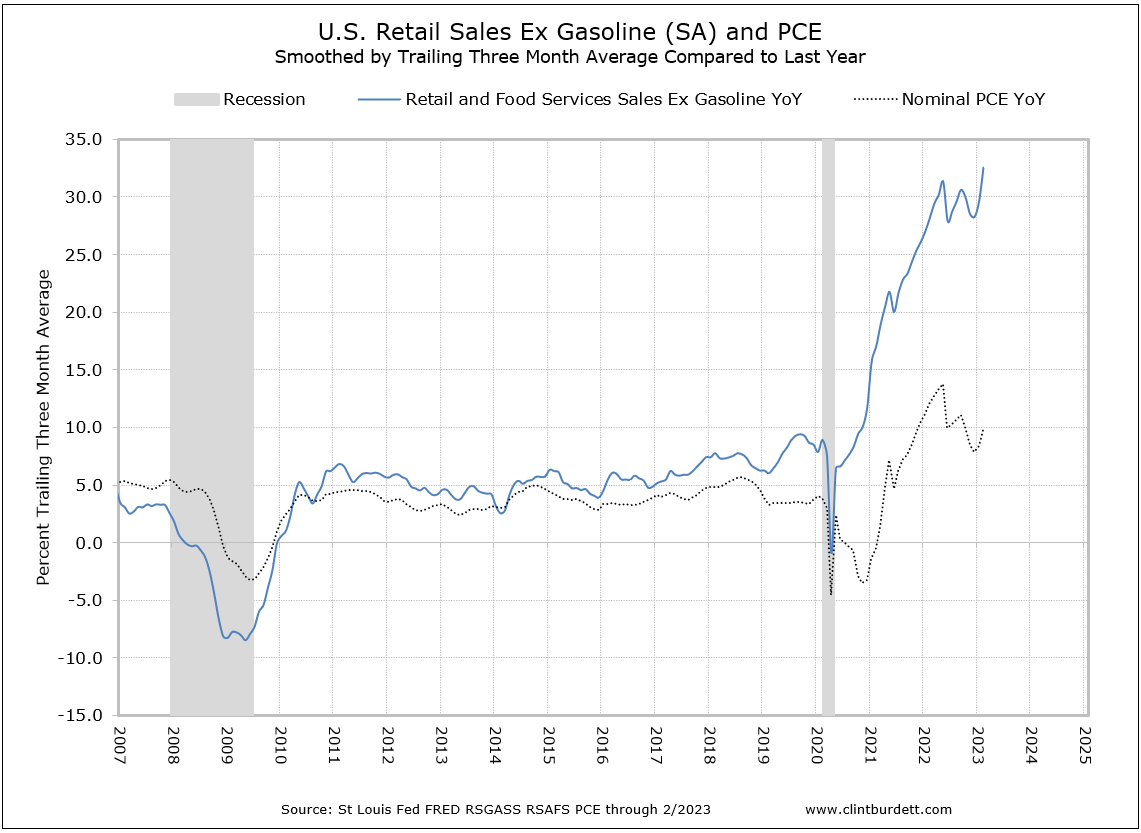
Three charts about Total Retail Sales demonstrate my observations. The first seems rosy; the second suggests gas is less "critical" in our spending decisions; but the third shows the retail sales growth rate is slowing down -- all from the same data.
Retail sales are returning to the slope of the historical trend, having lost 41 months after the end of the Great Recession. That is the headline bit.

Click to see larger chart
Gasoline sales are also growing but not with the same slope. That is reasonable with a more fuel efficient fleet. The good news is more is being spent on other items than gas; the gap is widening. That is the next detail level down, looking at particulars.

Click to see larger chart
Last is the pace of growth. Compared to the same month the previous year, the rate of growth of US Retail Sales excluding Gasoline is trending down as is nominal Personal Consumption Expenditures.
Look at the average growth rate line since the February 2011 peak growth for Total Retail Sales ex Gasoline (horizontal red line) in the next chart.
In the most of the last twelve months, we are trending below the 5.6% average improvement in sales for the last 32 months, inline with reduced personal consumption expenditures compared the last year.
Still steady as you go, slow, growth far into the recovery.

Click to see larger chart
You may not reprint this article for sale without my expressed written permission.
You may post or reprint this article to educate as long as you credit my work
and provide a link to www.clintburdett.com
|
|